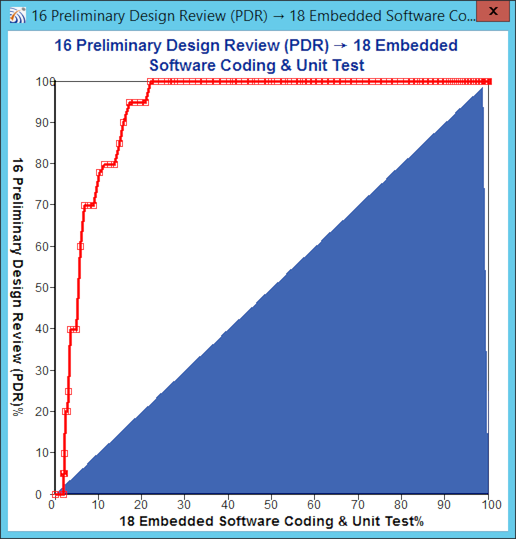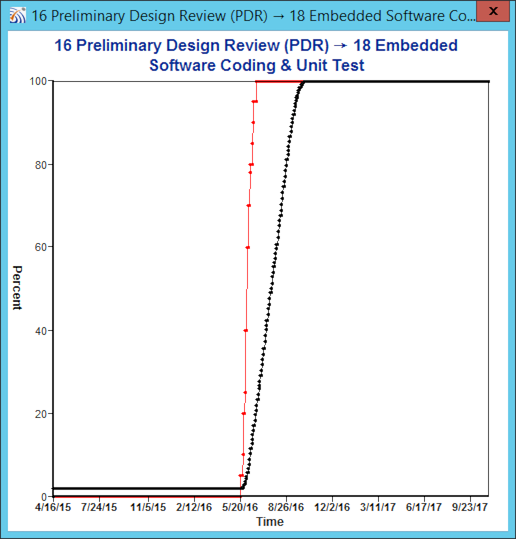
Dependency timelines display the progress of one activity or phase with respect to the other and also display both with respect to time.
Both views display in their own window and the windows can be launched simultaneously.
The windows can be dragged to change their size, the x- and y-axes will adjust to fit the new window size.
To close the window, select the X in the upper right corner.

The above window was generated by selecting the Dependency button on the Dependency detail pane. It is uneditable but similar to the Teamport Designer dependency editor. The red line shows simulated progress of one task or phase with respect to the other over the life of the dependency, with each square representing one point on the time horizon. Note that the simulator will appear to violate dependencies in certain cases, as can be seen in the bottom left corner. These apparent violations are a normal part of the simulator function when they are small.

The above window was generated by selecting the Timeline button on the Dependency detail pane. It is uneditable. It shows that the 18 Embedded Software Coding and Unit Test activity (black line) started and then was stopped by the dependency to the 16 Preliminary Design Review (PDR) activity (red line). Because the time horizon setting for the forecast was large, the first chunk of work was substantial enough to be seen on the vertical axis before being stopped by the pace dependency. This behavior is normal and due to the coarse-grained simulation in combination with the way dependencies are treated during simulation.